Incident Management Playbook for Data Pipeline Failures
Data pipelines fail silently, so teams need a playbook before crisis hits.
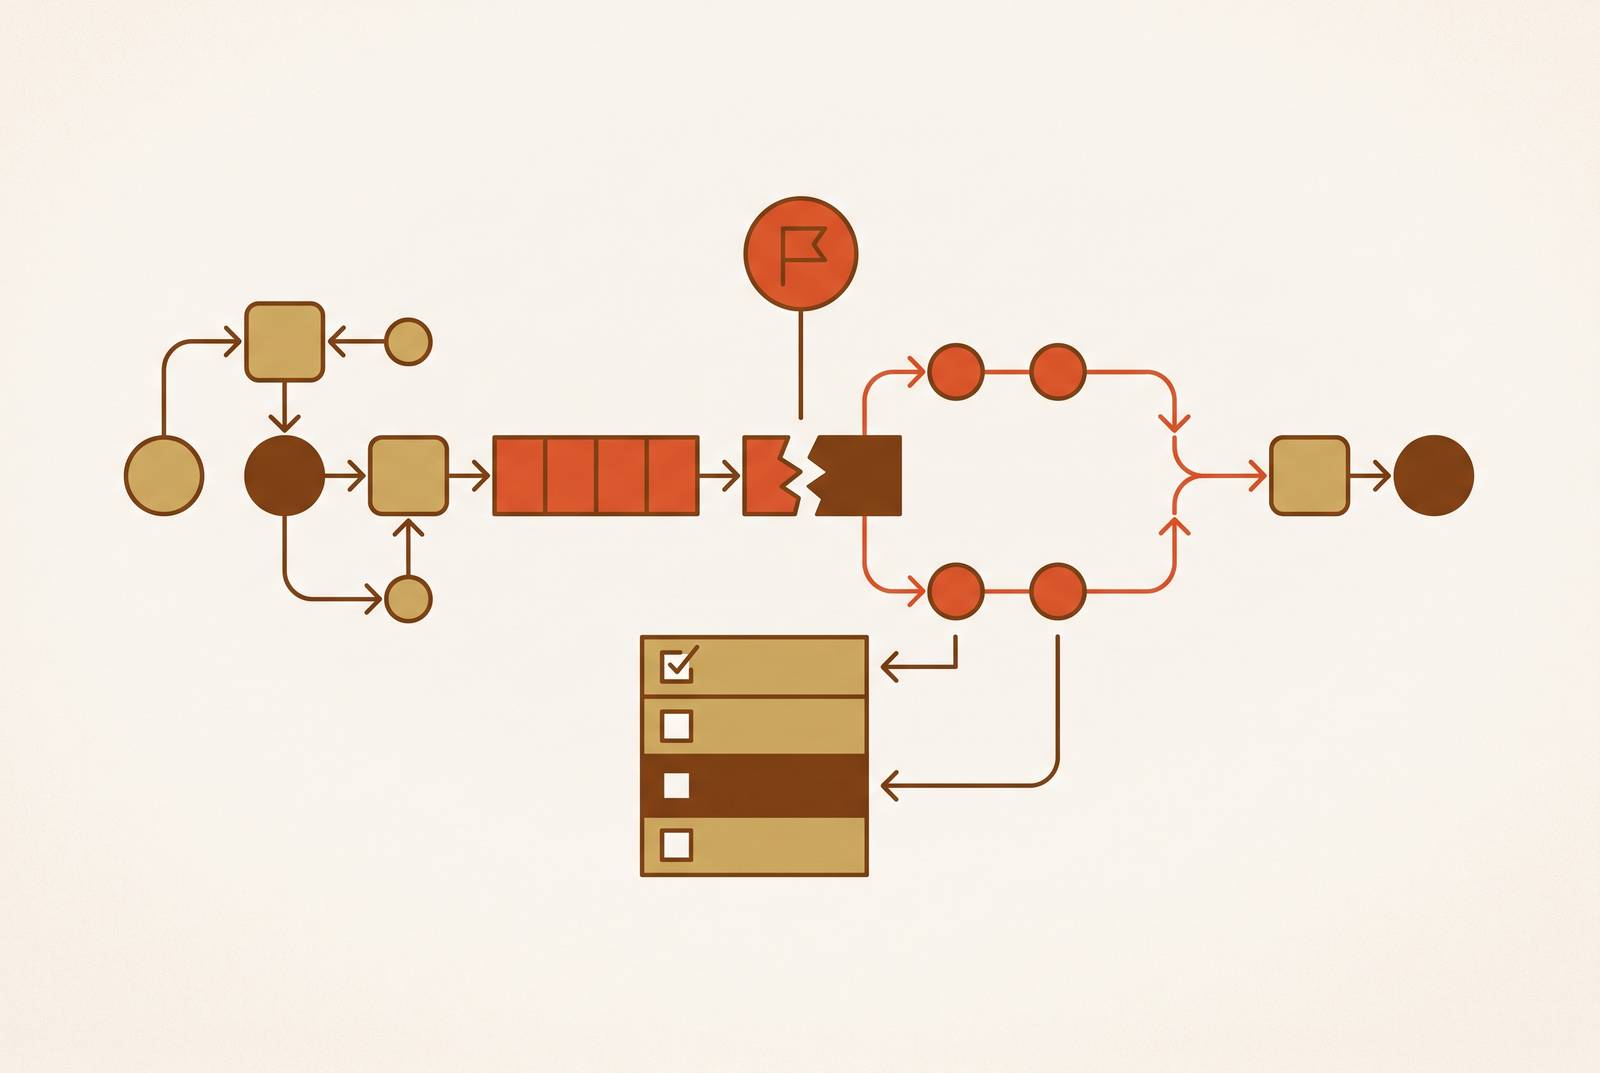
A software outage announces itself. A 500 error fires, latency spikes, a health check fails, and the on-call engineer knows within seconds that something is broken. A data pipeline failure does nothing of the kind. A stale list, a dashboard that's quietly wrong for three days before anyone questions it, or a duplicate record that splits one account into two reveals a data pipeline failure. None of those events trips an HTTP monitor, because none of them is an infrastructure problem. The pipeline ran. The job completed. The data was simply wrong, and nothing in a standard ops stack was built to notice.
That silence is the entire argument for treating data incidents as their own discipline rather than a subcategory of software incident response. Each axis needs its own instrumentation, and together they define what "reliable" even means to the people consuming the data downstream.
Two further facts make pipeline incidents harder to recover from than software ones. Improvising that response doesn't just slow the fix down. It leaves bad data flowing into models, dashboards, CRM records, and AI workflows for every hour the incident goes uncontained, and that contamination compounds the longer it runs.
What you need in place before the first incident
A playbook only works under pressure if its inputs already exist before the pressure arrives. Every data team needs four things on its readiness checklist, and you can build all four before a single incident occurs.
The first is a severity framework agreed on in advance, even something as simple as a Sev1 through Sev4 scale, so no one is debating classification while the clock is running. The fourth is a documented list of downstream consumers for each critical dataset, covering which dashboards, models, CRM syncs, and webhooks depend on it, because containment and notification are impossible without knowing exactly who is downstream.
Severity frameworks built for software outages are missing one axis that data incidents require: blast radius over time. A schema change that silently drops a field can look minor on the day it happens, but five days later, once every downstream model has trained on the gap it left behind, it can look like a full-blown emergency. Severity assessment for a pipeline incident has to account for where the problem is headed as much as where it sits right now.
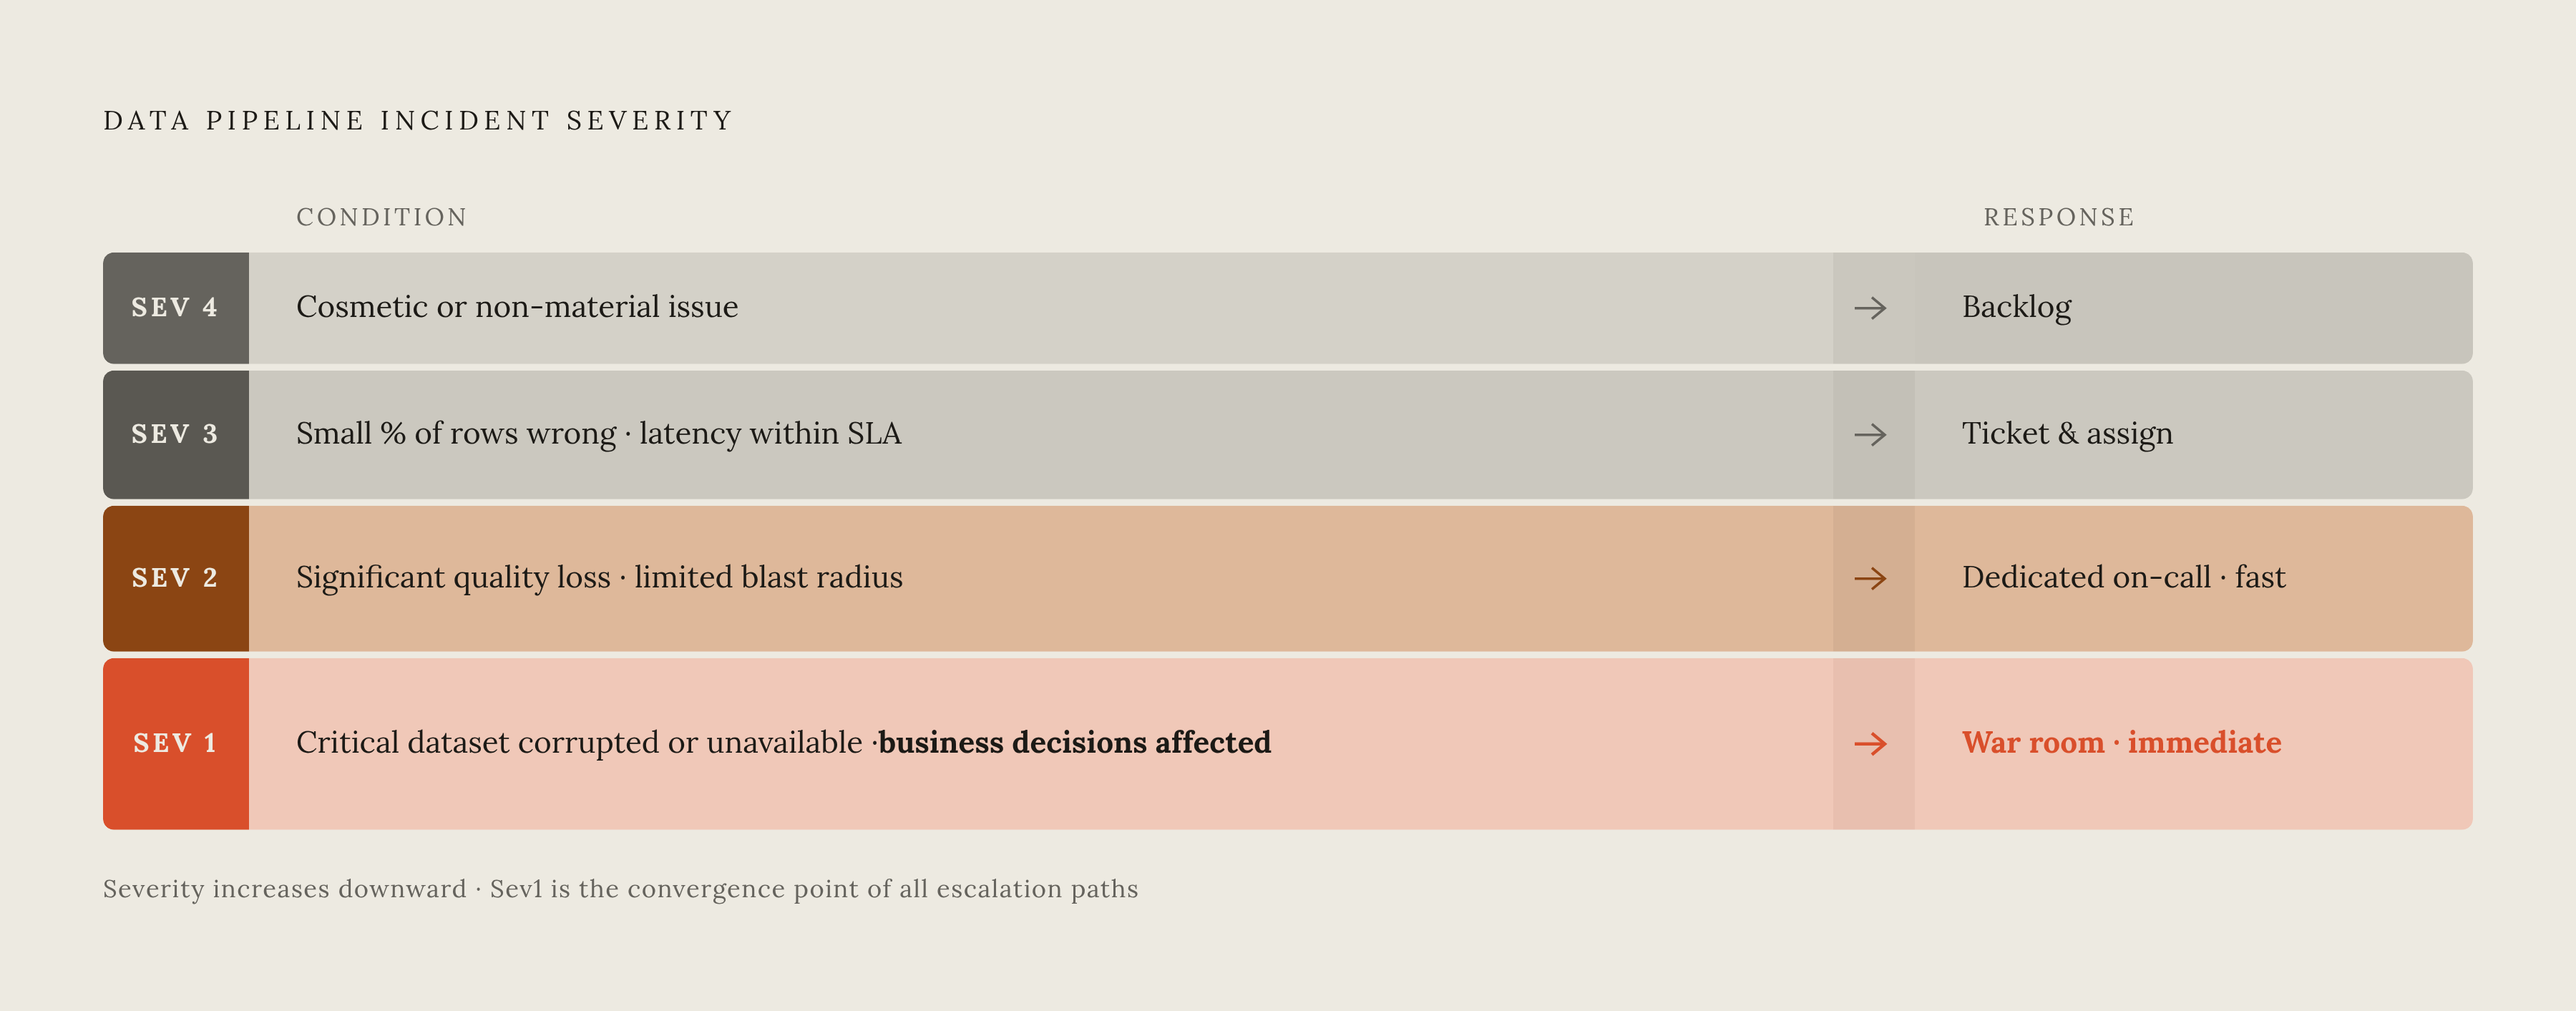
A compact reference scale, drawn from mature data incident practice, makes the gradient concrete:
| Severity | Description | Response | |---|---|---| | Sev1 | Critical dataset corrupted or unavailable, active business decisions affected | Immediate, war room | | Sev2 | Significant quality degradation, limited blast radius | Fast, dedicated on-call | | Sev3 | A small percentage of rows carry a wrong value but overall data is unaffected; latency degraded but within SLA | Ticket and assign, postmortem optional | | Sev4 | Cosmetic or non-material issue | Backlog |
Finally, every critical pipeline needs a runbook linked to its alerts before an incident ever occurs, not written in the middle of one. A usable runbook has six fields: the triggering alert, the triage checks to run, the mitigation steps to apply, the common root causes to check, the rollback command, and the escalation path. That document is what removes dependence on the two or three senior engineers who otherwise carry the whole system in their heads.
Step 1: Detecting a failure before a stakeholder does
Every subsequent step in this sequence depends on detection happening fast and happening automatically, because each additional hour a failure goes unnoticed extends its blast radius further into downstream decisions. This is where the cost curve of an incident gets decided: catching a bad record at the source, before it has influenced a dashboard, a model, or an outreach send, costs an order of magnitude less than untangling the consequences after the fact. Automated detection is what keeps an incident cheap.
Thresholds work best framed as business-impact service level objectives. "All messages processed within five minutes at 99.9% availability" is a threshold an on-call engineer can act on immediately; a bare numeric rule divorced from business impact tends to generate noise and gets ignored. Each of the four failure axes needs its own detection signal to match: freshness is measured as the age of the latest record against expected arrival time; completeness is the fraction of expected source rows that have landed within the SLO window; volume is whether the row count sits within a band derived from a rolling baseline; and quality is the fraction of rows passing schema, non-null, and referential integrity checks.
Pipelines that consume an external API or webhook need delivery itself monitored directly. A failed delivery that fails silently looks identical to normal operation from the outside, and that is precisely the kind of detection gap that goes unnoticed for days. None of this is a dashboard problem that gets solved by giving stakeholders a prettier chart to check. It gets solved by automated detection built as close to the source as the pipeline allows.
Step 2: Triaging severity and blast radius in minutes, not hours
Triage exists to allocate urgency correctly, since not every corrupted record is an emergency. Answering those three questions determines severity without anyone needing to debate it.
Severity for a data incident is a function of trajectory more than current state. The action that matters most at this stage is procedural: assign an incident lead and open the incident log within ten minutes of acknowledgment. That single step removes the ambiguity of who is actually handling the problem, an ambiguity that tends to double response time on its own.
Response targets scale with severity. A Sev1 calls for a response within 15 minutes, paging the primary and secondary on-call plus a manager, and opening a war room. Triage is measurable: mean time to resolution breaks down into time to detect, time to acknowledge, time to mitigate, and time to resolve, and a disciplined triage process directly compresses time to acknowledge while giving the responder enough context to shorten time to mitigate as well.
Step 3: Containing the incident before it spreads to new records and systems
Containment is the action that stops the blast radius from growing while the fix is still being built, and it has to happen before diagnosis starts. The most common failure at this stage is communication: an engineer contains the data issue but leaves every downstream consumer operating on bad data for hours because nobody told them to stop.
Pausing writes to the affected table is the strongest lever available, and where a full pause isn't practical, flagging the dataset as unverified at least warns consumers not to trust it blindly. Quietly fixing the problem without telling anyone who already acted on the bad data doesn't solve anything; it just defers the damage to a later date.
Containment options run on a spectrum of aggressiveness, and the severity level set in Step 2 determines which one applies. Not every incident justifies the kill switch, and part of good triage is matching the lever to the actual severity rather than defaulting to the most drastic option out of caution.
Step 4: Diagnosing root cause through lineage, not log archaeology
Without a lineage graph, diagnosis turns into Slack archaeology: reconstructing the dependency chain from memory, grepping through logs, asking around for who changed what last. That process is slow, error-prone, and dependent on the senior engineers who are hardest to pull into an active incident. A lineage graph turns the investigation into a traversal problem instead of a search problem, letting an engineer trace upstream from the broken output to the exact point where data was corrupted or delayed.
The runbook attached to the alert is the right starting point, because it should already encode the common root causes and the order in which to check them. Those 20 minutes were pure waste, caused entirely by a runbook that never listed "check the connector" as a step.
The 5 Whys method maps naturally onto the lineage path for pipeline incidents: start at the failed downstream output and ask why at each upstream node until the trail lands on something actionable, a schema change, a connector timeout, a dropped feed, a filter bug. A useful order to check root-cause categories runs roughly as follows: an upstream schema change deployed without coordination, a connector or ingestion outage caused by an API rate limit, a credential expiry, or a network interruption, a pipeline execution fault such as a failed job or exhausted resource, real-world data variation that trips a constraint the pipeline wasn't built to handle, and orchestration issues like a misconfigured DAG dependency or a missed schedule. After the incident closes, the runbook for that pipeline should be updated with whatever root cause wasn't already listed, so the next engineer who hits a similar failure finds "check the connector" in step one instead of discovering it in step four, 20 minutes too late.
Step 5: Remediating the pipeline and repairing the data it already wrote
Fixing the pipeline is not the same task as fixing the data the pipeline already wrote. A corrected connector still leaves every record it touched during the outage wrong until someone explicitly goes back and reprocesses them. If you close the incident before that happens, corrupted data sits in production systems indefinitely.
Remediation runs through two gates, and both have to clear before the incident can be called resolved. Gate one is the pipeline itself: the root cause gets addressed, new records start flowing correctly, and the same automated checks that caught the incident in the first place confirm the fix is holding. Gate two is the data already written during the incident window: every affected record gets identified, corrected or reprocessed, and validated, with nothing left unaccounted for.
Validation should run the same four axes used in detection, freshness, volume, schema, and distribution, re-checked against the affected table. Downstream consumers need a second notification once the incident actually closes, confirming the data has been repaired, since they paused workflows or flagged records as unverified during containment and need an explicit signal before they resume trusting the dataset again.
Records written during the incident window may already have been acted on: outreach sent, leads scored, accounts routed to the wrong rep. Those downstream business actions often need to be reviewed or corrected on their own, because fixing the pipeline does nothing to undo a decision a human or a model already made on the bad data.
Step 6: Running a blameless postmortem that changes something
A postmortem that ends with a timeline and a root-cause statement but no new monitoring commitment is just a historical record. The same failure will resurface the next time the same conditions line up. The blameless framing isn't a cultural nicety, it's a structural requirement: asking how the system allowed the failure produces useful answers, while asking who made the mistake produces defensiveness, underreporting, and postmortems that describe symptoms instead of causes.
A complete postmortem document, following mature data incident practice, contains a one- to two-sentence summary of what happened and what was affected; a precise timeline covering when the failure began, when detection fired (or when a stakeholder reported it, and if that's what happened, why detection failed to catch it first), when containment was applied, when root cause was identified, when the pipeline was repaired, and when the data was validated; the stated root cause, along with any contributing factors that made the incident worse; the detection method, specifying whether automated monitoring or a stakeholder caught it; at least one concrete monitoring change that would catch the same failure automatically next time, with a named owner and a due date; and action items, each with an owner and a due date, tracked in the issue tracker rather than left to decay inside the postmortem document itself. Action items without an owner and a due date are just wishes.
The postmortem closes the loop directly back to Step 1, and that loop is the entire point of running one. The single most important output of a postmortem is a new or updated detection check. If a stakeholder discovered the incident before any automated monitor did, the postmortem isn't finished until a check exists that would have caught it first next time.
Agentic detection and remediation in the manual playbook
A six-step playbook executed entirely by humans is the right foundation, but it has a ceiling. As the number of pipelines, downstream consumers, and AI-dependent workflows grows, the manual process itself becomes the bottleneck the playbook was designed to remove from incident response. The constraint is capacity: a large share of data engineering time already goes toward maintaining and troubleshooting existing pipelines rather than building new data products, so the manual playbook consumes the same scarce engineering capacity it exists to protect.
AI-adjacent pipeline failures carry a second-order consequence the manual process can't address fast enough on its own. The underlying shift is from alerting to acting. Alerting tells a team something is wrong; an agentic approach to data reliability detects the anomaly, proposes an evidence-based fix, and can apply it autonomously, compressing the window between detection and containment from hours down to minutes and removing the dependency on the handful of senior engineers who otherwise hold the pipeline graph in their heads.
For CRM and RevOps systems of record specifically, where data decays continuously and bad records corrupt AI lead scoring, outreach personalization, and revenue forecasting all at once, continuous autonomous monitoring and enrichment is the only approach that keeps pace. Periodic manual audits, however well-run, cannot match the rate at which this kind of data decays.