Measuring DataOps Team Performance With Reliability Metrics
Trust reliability metrics, not just pipeline uptime, to measure DataOps team maturity.

Measuring DataOps team performance requires a distinction between successful execution and reliable data. Pipeline uptime shows whether delivery systems work, but not whether people or AI can trust their output. A reliability-first framework measures data quality and incident response together, giving leaders a defensible way to assess team maturity and justify proactive, automated quality operations.
Why pipeline uptime is the wrong scorecard for DataOps teams
Most DataOps teams report pipeline health to leadership through success rates, job completion and uptime. But leaders need data they can trust for decisions and AI. A pipeline can complete on schedule while delivering stale, incomplete or schema-drifted records. In that case, the reported success conceals the failure that matters to the consumer.
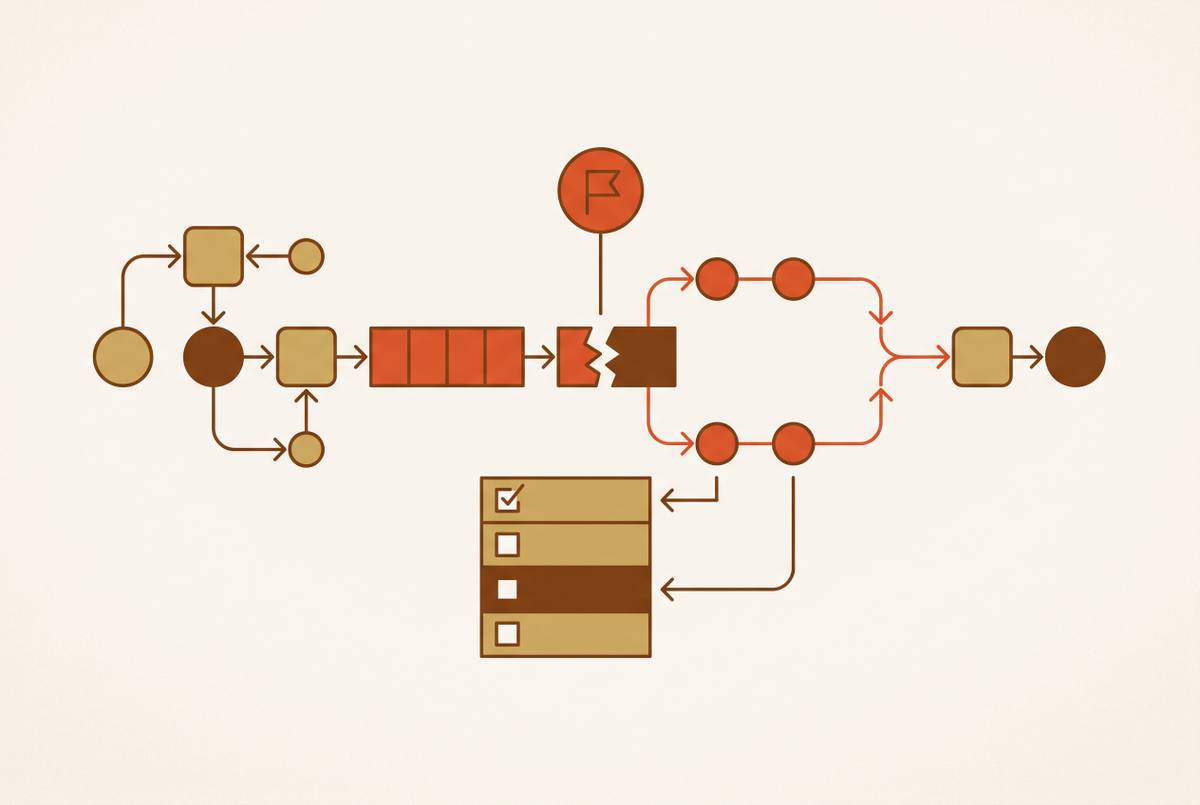
Binary job-status monitoring misses these failures because it asks only whether the job exited with code 0. An outright crash gives the team an unmistakable signal, while a silent quality failure can remain hidden until a downstream report exposes it. Databricks' 2026 DataOps guide makes this distinction explicit by describing how automated testing catches schema issues at the ingestion boundary, while corrupted reports can otherwise surface days later in a board meeting.
Without SLAs for data quality, a team has no objective standard for distinguishing technically delivered data from data fit for use. It also lacks a clear basis for showing that its operations are becoming more mature. Pipeline availability remains useful, but it cannot carry the argument for investment in better quality operations on its own.
What a reliability-first metric set actually measures
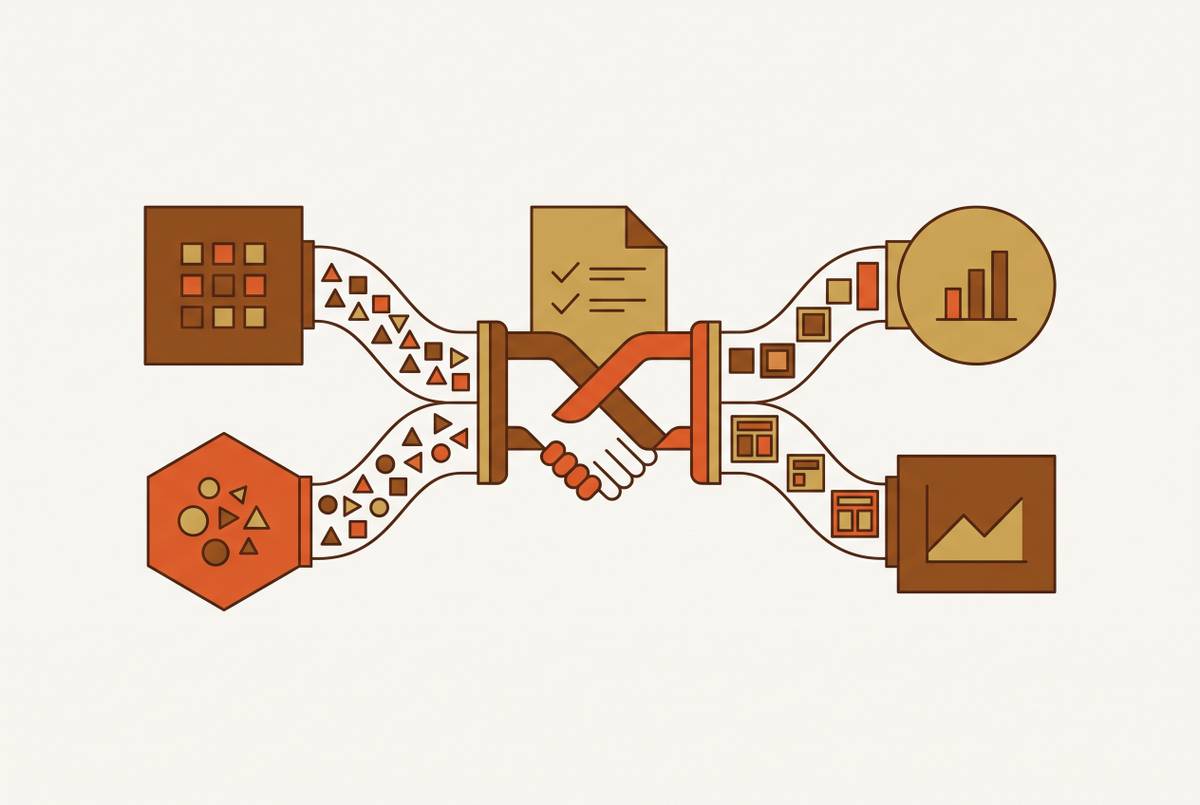
A reliability-first framework asks whether a downstream consumer can trust what the pipeline delivered. It organizes the answer into three connected tiers, which are Service Level Indicators, Service Level Objectives and business KPIs. Service Level Indicators, or SLIs, are technical signals of data health, including completeness, accuracy, freshness, volume anomalies and schema drift incidents. Service Level Objectives, or SLOs, set the reliability targets behind the SLA a data product promises its consumers. Business KPIs describe the consequences of meeting or missing those targets, including decision quality, AI model reliability and revenue attribution accuracy.
The team can use six core metrics within that structure to build a performance scorecard. Completeness is the percentage of expected records present, exposing truncated loads and missing upstream data. Accuracy is the match rate against a validated reference, distinguishing data that arrived from data that arrived correctly. Freshness measures the elapsed time between data generation at source and availability for query, with SLA adherence expressing performance against the committed window.
Mean Time to Detect, or MTTD, is the average time from when a quality incident occurs to when monitoring flags it. Mean Time to Resolve, or MTTR, is the average time from detection to remediation. Alert noise ratio is the share of automated notifications that require no engineering action. These measures separate the quality of the data from the responsiveness of the operation, making it possible to see whether failures persist because they remain unseen or because resolution takes too long.
Why catching quality failures at the source changes everything downstream
The interval before detection matters because a quality defect does not stay confined to its origin. Once it passes through ingestion, every downstream transformation it touches adds to the scope of remediation. A missing API field caught at the boundary is a localized issue, while the same missing field discovered in a broken report can require hours of debugging. By then, the team must understand not only the original defect but also its effect on the data that followed. Detection time is therefore a financial concern as well as an operational one.
Schema drift shows how this propagation happens without a failed job. An upstream system changes a column type or drops a field without notice. The pipeline continues to run, the job exits with code 0, and downstream tables become silently wrong as the affected data passes through dozens of transformations. An analyst then reports a bad number from the resulting dashboard.
That distance changes the work required to restore trust. A defect caught at ingestion costs a fraction of what it costs to remediate after it has shaped a dashboard, trained a model or influenced a decision. Once dependent outputs have been affected, the team must both fix the source and establish how far the defect propagated. Early detection keeps that scope smaller before the failure becomes a question about the reliability of multiple downstream assets.
MTTD makes this exposure measurable. Every hour removed from detection time is an hour fewer in which faulty data can continue to contaminate downstream work. A low MTTD means the operation spends less time blind to defects. Detection speed therefore belongs in both a team performance framework and a monitoring dashboard.
How automated monitoring compresses MTTD and MTTR in practice
Proactive monitoring reduces that blind interval by evaluating the data itself. It checks volume, freshness, null rates and schema stability even when a job reports that it finished successfully. Statistical baselines can flag an unusual row-count drop without waiting for a hard failure threshold. This changes the trigger for investigation from a broken process to evidence that its output has departed from expected behavior. The architecture detects silent failures because it does not depend on execution failure as its signal.
Lineage shows which downstream assets the issue affects, so engineers can see how far it has spread before consumers find the damage. Databricks' DataOps strategy describes how continuous monitoring narrows an incident to a single pipeline stage, converting a multi-hour investigation into a minutes-long fix. Monitoring compresses MTTD by identifying the defect and supports lower MTTR by narrowing the work needed to resolve it.
A practical starting point is automated row-count and freshness checks across all critical tables before more complex validation. This pattern catches 60% of common pipeline failures with minimal configuration effort. Its value is that it covers common failure modes without requiring a fully developed validation program. More elaborate checks can then extend that coverage without delaying the first useful signals.
When a system fires too many false positives, engineers learn to ignore its notifications and can more easily miss real failures. Alert noise ratio therefore measures a condition on which the rest of the architecture depends. More monitoring is not automatically better monitoring, and a growing alert queue is not evidence of greater control. The operational gain comes from detecting meaningful deviations and giving the team enough context to act.
Why a reliability metric framework is how DataOps leaders quantify team maturity
For a DataOps leader, these metrics turn operational changes into a reportable account of progress. Freshness SLA adherence shows whether consumers receive data when promised, while MTTD and MTTR trends show whether the team is becoming faster at detecting and resolving failures. Pipeline success rate alone cannot show those improvements. Even if a team already has a dashboard, it may measure only execution state, leaving open whether the data can be trusted.
The three-tier framework makes that evidence legible to different audiences without changing the underlying argument. Engineering needs technical indicators such as query latency, schema drift count, alert noise ratio and pipeline execution time. Operational reporting places freshness adherence, completeness pass rates and MTTD and MTTR trends against reliability targets. Reports for executives show how those results relate to data downtime avoided, AI model reliability and revenue reporting confidence.
Trends then make maturity visible in a way that uptime cannot. A team moving from reactive response to proactive anomaly detection can show declining MTTD over quarters. A team investing in automated remediation can show whether MTTR declines as a result. Those changes give leaders evidence for headcount and tooling decisions instead of requiring them to argue from workload alone. They also distinguish the ability to notice problems from the ability to act on them.
The same distinction matters in the systems of record that revenue and go-to-market teams depend on. CRM data degrades continuously as contacts change roles, companies are acquired and fields go stale. None of these changes needs to trigger a pipeline alert because data can move successfully while becoming less accurate. Missing owner fields, empty industry codes and contacts that have no associated accounts are completeness failures that break territory planning and segmentation. Duplicate records, mismatched company names and stale job titles are accuracy failures that corrupt attribution models and routing logic.
Freshness failures create a related problem when lifecycle stages are not updated after product events or deal stages no longer reflect reality. Forecasting and pipeline reporting then rely on an outdated account of the business. Duplicates and stale fields also break workflow automation and disrupt data syncs across the GTM tech stack, spreading errors into dependent systems. People who review an alert queue cannot keep up at scale as data keeps decaying with few clear signals, so continuous monitoring and autonomous action are especially important. A reliability framework gives leaders a way to express that need as a measurable, reportable commitment rather than a general assurance that the data team is working on quality.
Building the reliability metric framework: what to instrument first and how to grow it
The framework does not need to be fully instrumented on day one. Freshness and completeness checks on the most critical tables provide a starting point where common failures can be exposed with minimal configuration. These checks get teams into the habit of measuring data health instead of relying on job status to tell them whether the data is sound. MTTD and MTTR should be recorded from the first incident so that improvement has a baseline. Even a rough starting measure gives the team a direction of travel to report.
SLOs come next, before the team adds more metrics. A freshness SLA expressed as data available within X minutes of source event turns elapsed time into a commitment that can be met or missed. Completeness and accuracy also need standards so the team can judge how well it is doing. Once freshness and completeness baselines are stable, accuracy and schema drift monitoring can add depth. Adding complexity before that foundation is stable produces noise and leaves reliability no clearer.
CRM and RevOps systems need a slightly different starting point because different defects have the most immediate effects on revenue. Duplicate detection and completeness checks should begin with the fields that feed routing and attribution, including owner, account and lifecycle stage. This applies the same framework to the failures that matter most in those systems rather than copying the order used for pipeline tables. The executive layer should follow once SLOs are defined and tracked. At that point, translating performance into data downtime, AI model reliability and forecast accuracy becomes a reporting exercise.
The maturity payoff is a change in what the leader can demonstrate. Declining MTTD over consecutive quarters shows movement away from discovering failures through their downstream consequences and toward limiting their propagation. Freshness SLA adherence establishes whether that operation also delivers on its promises to consumers. When those measures are supported by faster, localized resolution, the case for proactive, automated quality operations rests on performance. The team is no longer reporting only that pipelines ran, but showing how reliably their output can be trusted.